
Buckle up or strap on your helmet because we’re about to take you on a bone-rattling journey through the most pothole-ridden, crater-filled roadways this country offers. Whether you’re a diehard gearhead with a need for speed or a born-again biker living life a quarter-mile at a time, these states will put your suspension (and your nerves) to the ultimate test.
A report by Consumer Affairs rounded up the roughest rides that’ll have you gripping the wheel or handlebars for dear life. Forget off-roading – these beaten paths will make you wish you invested in a tank instead of that sweet set of wheels. If you think your state has the worst roads, you are about to find out.
Below are the states in order of worst roads to best roads based on three factors: car accident fatalities, road surfaces, and road improvement spending.
1. Rhode Island

2. Hawaii
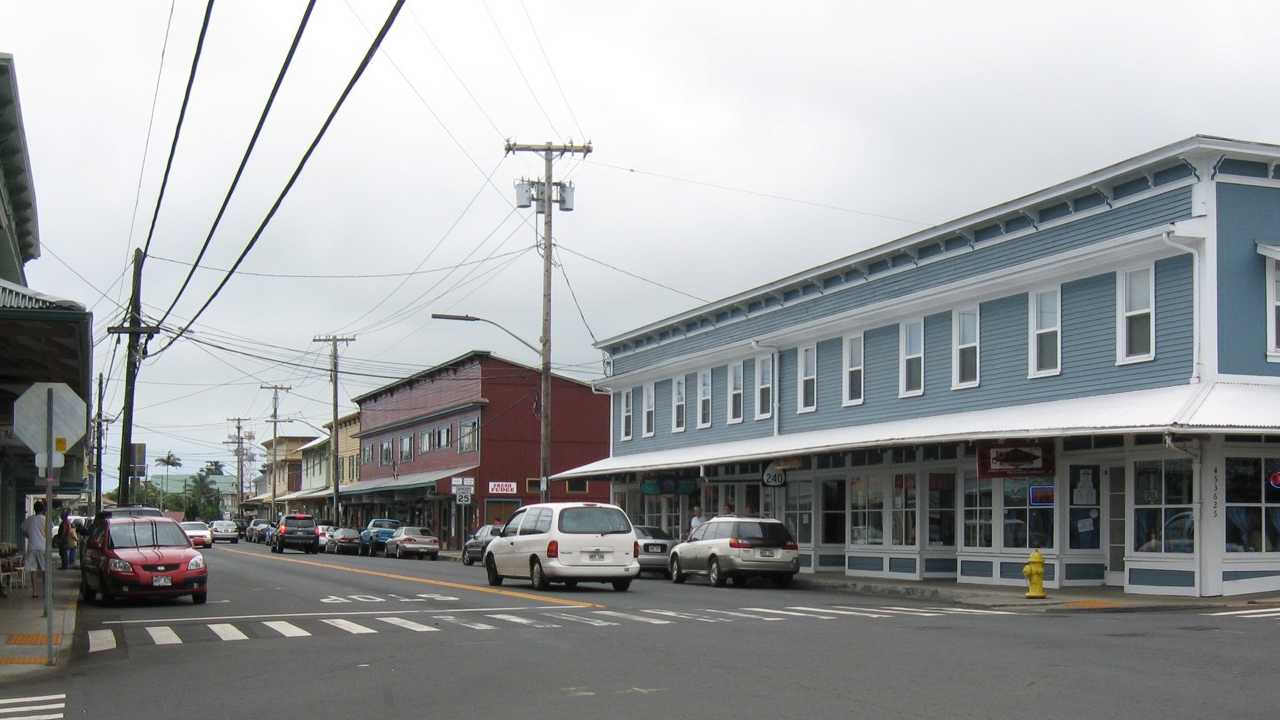
- Fatalities per 100 million miles driven: .97
- Percentage of rural roads rated poor: 17%
- Percentage of urban roads rated poor: 26%
- Yearly road improvement spend: $560 million
3. California
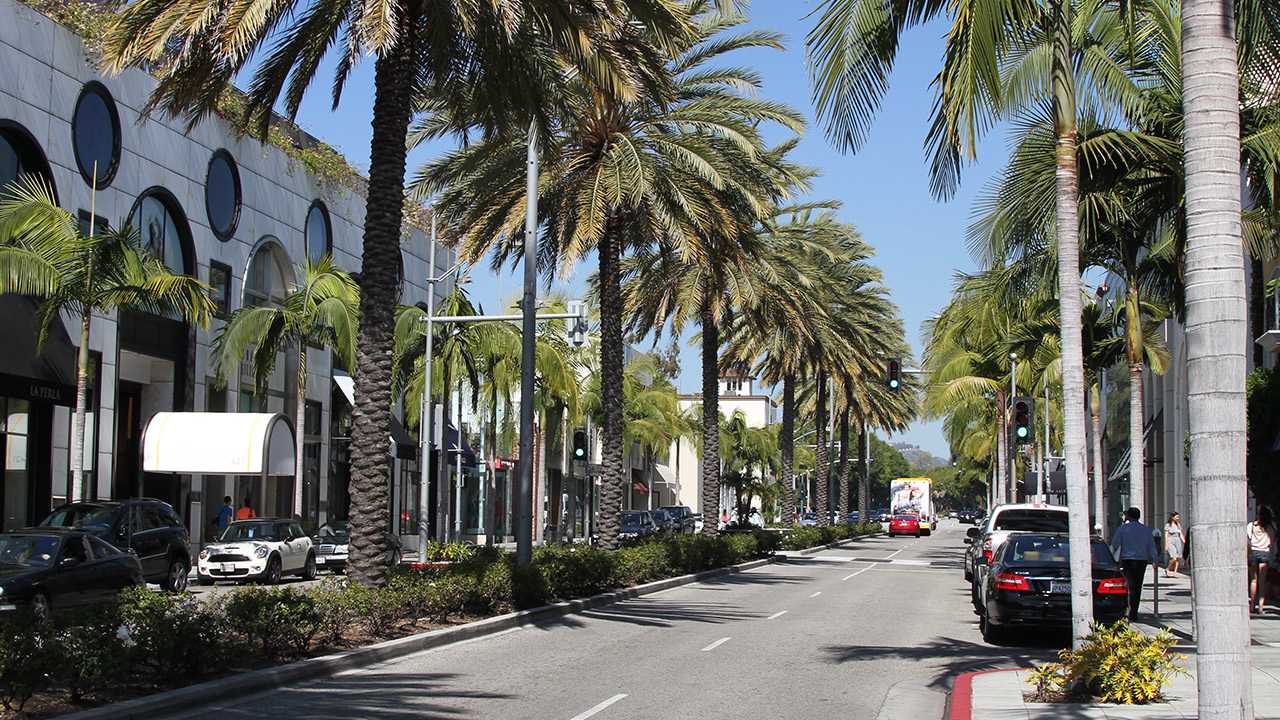
- Fatalities per 100 million miles driven: 1.28
- Percentage of rural roads rated poor: 5%
- Percentage of urban roads rated poor: 44%
- Yearly road improvement spend: $14.980 billion
4. Louisiana

- Fatalities per 100 million miles driven: 1.71
- Percentage of rural roads rated poor: 7%
- Percentage of urban roads rated poor: 25%
- Yearly road improvement spend: $1.552 billion
5. Wisconsin
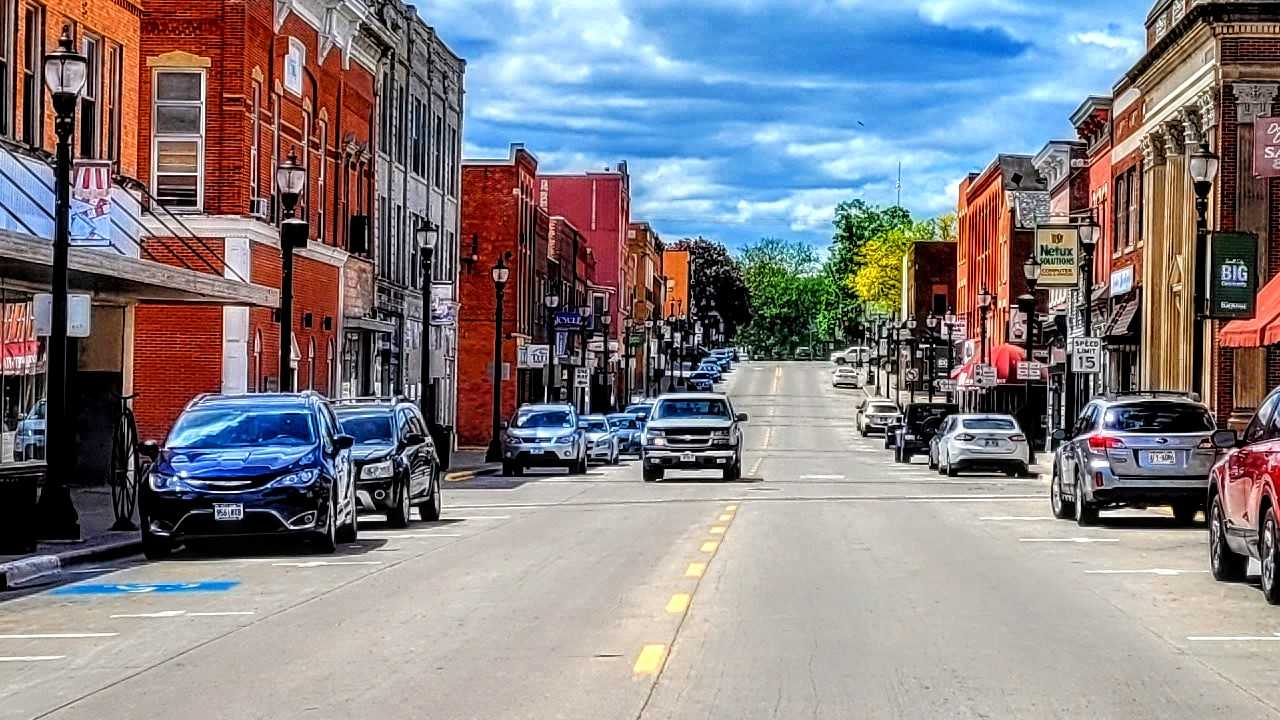
- Fatalities per 100 million miles driven: 1.07
- Percentage of rural roads rated poor: 6%
- Percentage of urban roads rated poor: 28%
- Yearly road improvement spend: $3.926 billion
6. New York

- Fatalities per 100 million miles driven: 1.02
- Percentage of rural roads rated poor: 4%
- Percentage of urban roads rated poor: 30%
- Yearly road improvement spend: $12.178 billion
7. Massachusetts
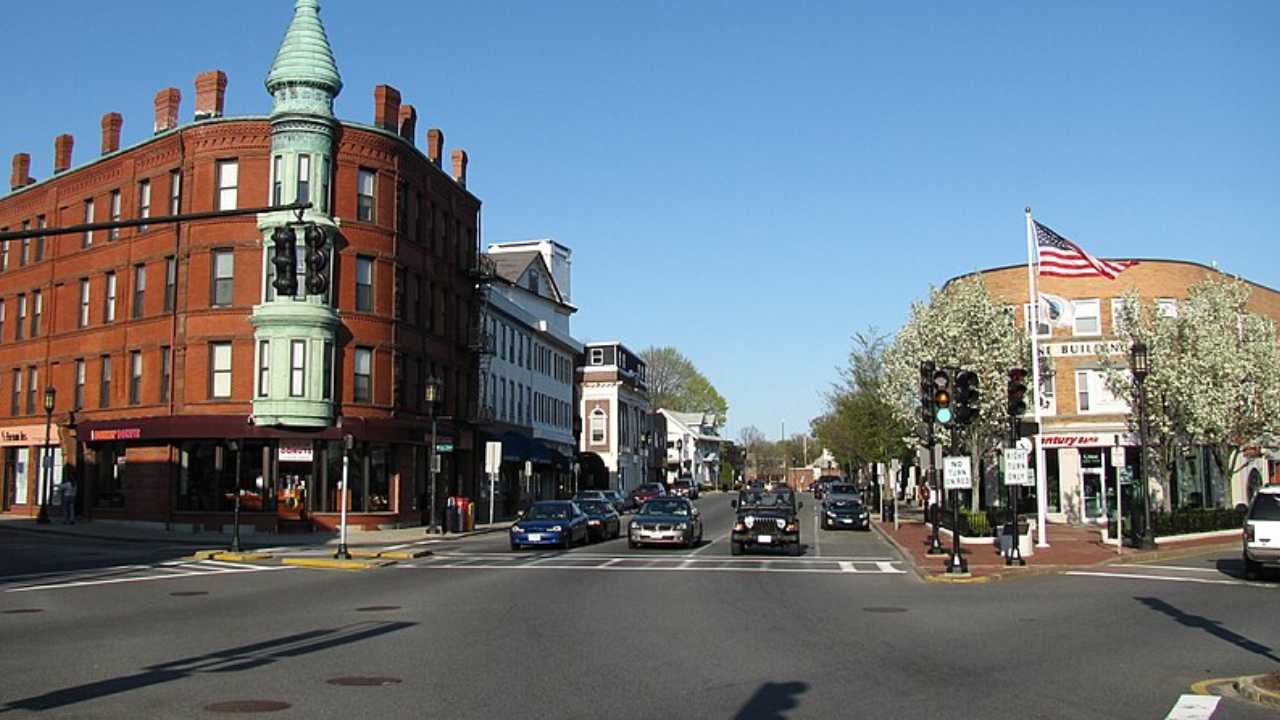
- Fatalities per 100 million miles driven: .63
- Percentage of rural roads rated poor: 7%
- Percentage of urban roads rated poor: 31%
- Yearly road improvement spend: $3.329 billion
8. Nebraska
- Fatalities per 100 million miles driven: 1.2
- Percentage of rural roads rated poor: 4%
- Percentage of urban roads rated poor: 34%
- Yearly road improvement spend: $1.653 billion
9. Arkansas
- Fatalities per 100 million miles driven: 1.88
- Percentage of rural roads rated poor: 6%
- Percentage of urban roads rated poor: 15%
- Yearly road improvement spend: $1.732 billion
10. Illinois
- Fatalities per 100 million miles driven: 1.27
- Percentage of rural roads rated poor: 6%
- Percentage of urban roads rated poor: 21%
- Yearly road improvement spend: $6.165 billion
11. New Jersey
- Fatalities per 100 million miles driven: .88
- Percentage of rural roads rated poor: 5%
- Percentage of urban roads rated poor: 27%
- Yearly road improvement spend: $5.168 billion
12. Washington

- Fatalities per 100 million miles driven: 1.04
- Percentage of rural roads rated poor: 5%
- Percentage of urban roads rated poor: 23%
- Yearly road improvement spend: $5.085 billion
13. New Mexico
- Fatalities per 100 million miles driven: 1.68
- Percentage of rural roads rated poor: 4%
- Percentage of urban roads rated poor: 14%
- Yearly road improvement spend: $783 million
14. Colorado
- Fatalities per 100 million miles driven: 1.28
- Percentage of rural roads rated poor: 5%
- Percentage of urban roads rated poor: 18%
- Yearly road improvement spend: $3.405 billion
15. West Virginia
- Fatalities per 100 million miles driven: 1.67
- Percentage of rural roads rated poor: 7%
- Percentage of urban roads rated poor: 12%
- Yearly road improvement spend: $1.432 billion
16. Iowa
- Fatalities per 100 million miles driven: 1.13
- Percentage of rural roads rated poor: 6%
- Percentage of urban roads rated poor: 20%
- Yearly road improvement spend: $2.678 billion
17. Texas
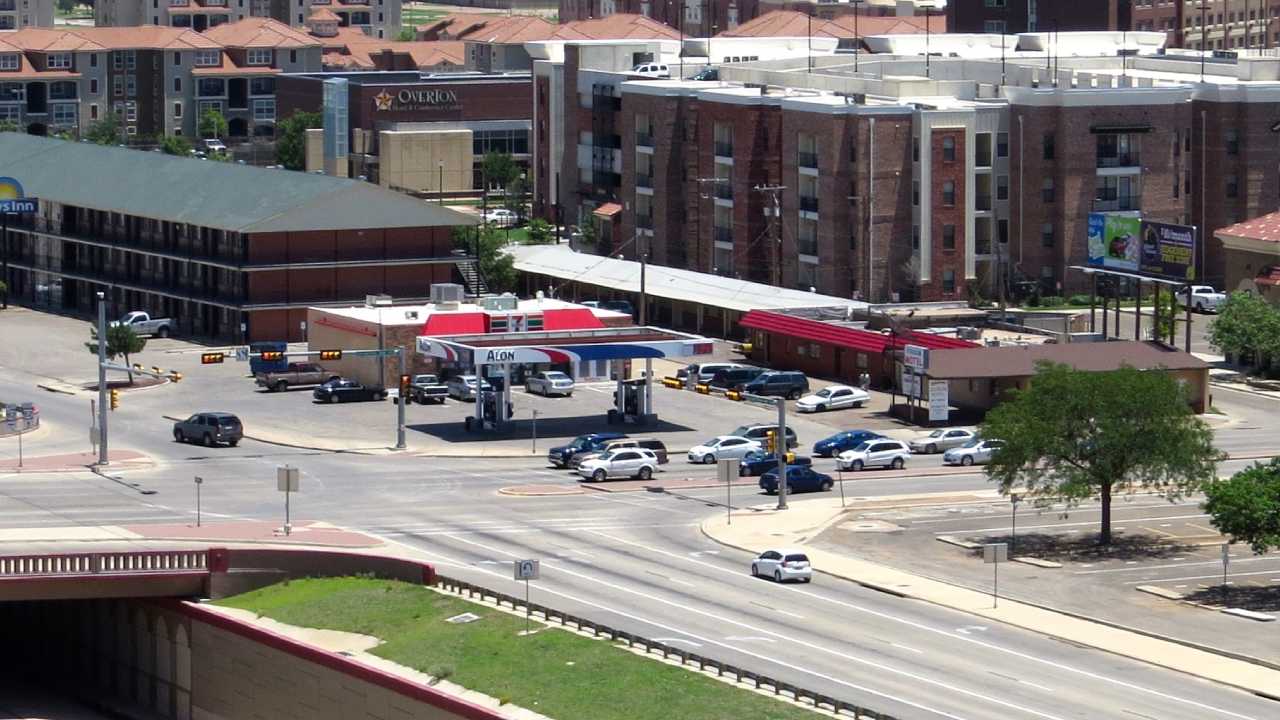
- Fatalities per 100 million miles driven: 1.49
- Percentage of rural roads rated poor: 2%
- Percentage of urban roads rated poor: 19%
- Yearly road improvement spend: $17.303 billion
18. Pennsylvania

- Fatalities per 100 million miles driven: 1.28
- Percentage of rural roads rated poor: 3%
- Percentage of urban roads rated poor: 21%
- Yearly road improvement spend: $14.545 billion
19. Mississippi
- Fatalities per 100 million miles driven: 1.21
- Percentage of rural roads rated poor: 3%
- Percentage of urban roads rated poor: 15%
- Yearly road improvement spend: $1.384 billion
20. Alaska
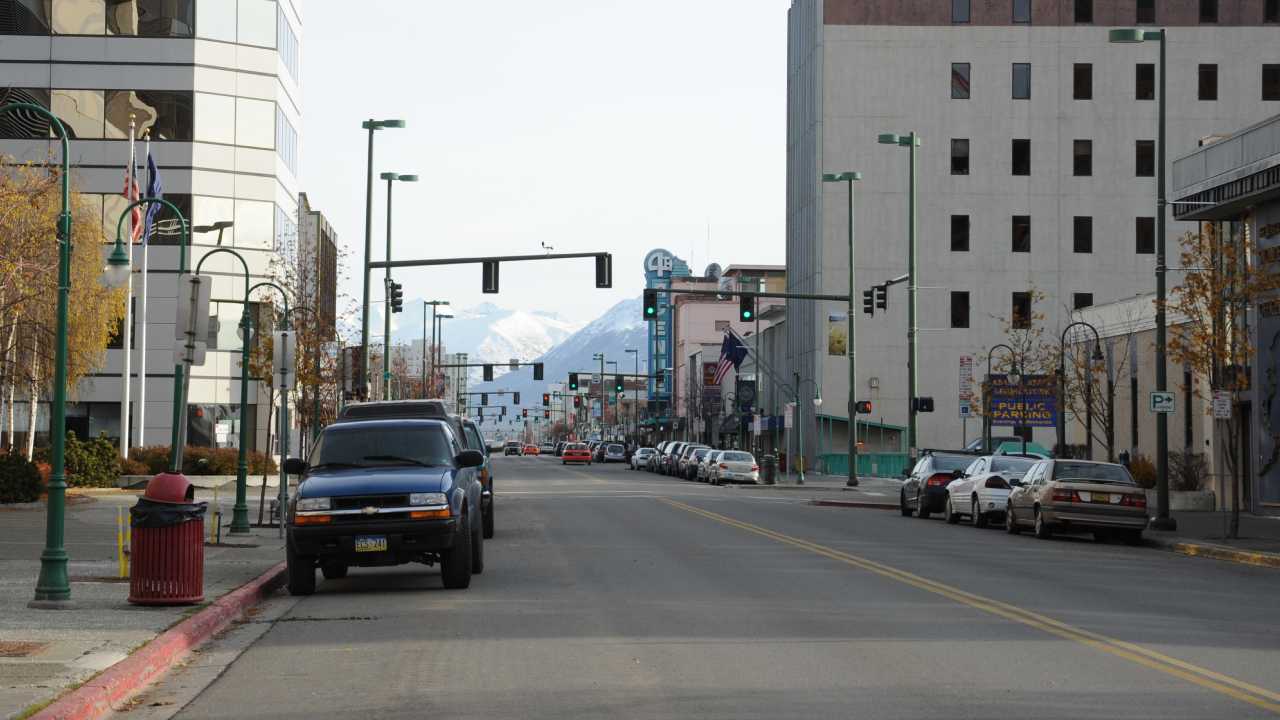
- Fatalities per 100 million miles driven: 1.21
- Percentage of rural roads rated poor: 16%
- Percentage of urban roads rated poor: 9%
- Yearly road improvement spend: $1.316 billion
21. Michigan
- Fatalities per 100 million miles driven: 1.25
- Percentage of rural roads rated poor: 3%
- Percentage of urban roads rated poor: 25%
- Yearly road improvement spend: $5.379 billion
22. Arizona
- Fatalities per 100 million miles driven: 1.6
- Percentage of rural roads rated poor: 5%
- Percentage of urban roads rated poor: 12%
- Yearly road improvement spend: $2.7534 billion
23. Oklahoma
- Fatalities per 100 million miles driven: 1.55
- Percentage of rural roads rated poor: 6%
- Percentage of urban roads rated poor: 11%
- Yearly road improvement spend: $2.704 billion
24. Montana
- Fatalities per 100 million miles driven: 1.76
- Percentage of rural roads rated poor: 2%
- Percentage of urban roads rated poor: 12%
- Yearly road improvement spend: $1.038 billion
25. South Dakota
- Fatalities per 100 million miles driven: 1.45
- Percentage of rural roads rated poor: 3%
- Percentage of urban roads rated poor: 15%
- Yearly road improvement spend: $715 million
26. Oregon
- Fatalities per 100 million miles driven: 1.57
- Percentage of rural roads rated poor: 2%
- Percentage of urban roads rated poor: 15%
- Yearly road improvement spend: $2.157 billion
27. South Carolina
- Fatalities per 100 million miles driven: 1.97
- Percentage of rural roads rated poor: 3%
- Percentage of urban roads rated poor: 11%
- Yearly road improvement spend: $2.884 billion
28. Connecticut
- Fatalities per 100 million miles driven: .98
- Percentage of rural roads rated poor: 4%
- Percentage of urban roads rated poor: 14%
- Yearly road improvement spend: $2.119 billion
29. Virginia
- Fatalities per 100 million miles driven: 1.12
- Percentage of rural roads rated poor: 2%
- Percentage of urban roads rated poor: 13%
- Yearly road improvement spend: $4.532 billion
30. Ohio

- Fatalities per 100 million miles driven: 1.19
- Percentage of rural roads rated poor: 2%
- Percentage of urban roads rated poor: 16%
- Yearly road improvement spend: $4.943 billion
31. Delaware
- Fatalities per 100 million miles driven: 1.39
- Percentage of rural roads rated poor: 2%
- Percentage of urban roads rated poor: 10%
- Yearly road improvement spend: $1.068 billion
32. Maryland
- Fatalities per 100 million miles driven: 1.11
- Percentage of rural roads rated poor: 3%
- Percentage of urban roads rated poor: 20%
- Yearly road improvement spend: $2.977 billion
33. Maine
- Fatalities per 100 million miles driven: 1.25
- Percentage of rural roads rated poor: 6%
- Percentage of urban roads rated poor: 13%
- Yearly road improvement spend: $1.228 billion
34. Kansas
- Fatalities per 100 million miles driven: 1.53
- Percentage of rural roads rated poor: 1%
- Percentage of urban roads rated poor: 10%
- Yearly road improvement spend: $1.444 billion
35. Wyoming
- Fatalities per 100 million miles driven: 1.3
- Percentage of rural roads rated poor: 2%
- Percentage of urban roads rated poor: 12%
- Yearly road improvement spend: $716 million
36. Kentucky
- Fatalities per 100 million miles driven: 1.68
- Percentage of rural roads rated poor: 2%
- Percentage of urban roads rated poor: 7%
- Yearly road improvement spend: $2.569 billion
37. North Carolina
- Fatalities per 100 million miles driven: 1.45
- Percentage of rural roads rated poor: 1%
- Percentage of urban roads rated poor: 8%
- Yearly road improvement spend: $6.823 billion
38. Missouri
- Fatalities per 100 million miles driven: 1.36
- Percentage of rural roads rated poor: 1%
- Percentage of urban roads rated poor: 10%
- Yearly road improvement spend: $2.472 billion
39. North Dakota
- Fatalities per 100 million miles driven: 1.14
- Percentage of rural roads rated poor: 2%
- Percentage of urban roads rated poor: 14%
- Yearly road improvement spend: $909 million
40. Nevada

- Fatalities per 100 million miles driven: 1.26
- Percentage of rural roads rated poor: 1%
- Percentage of urban roads rated poor: 9%
- Yearly road improvement spend: $1.554 billion
41. Tennessee
- Fatalities per 100 million miles driven: 1.6
- Percentage of rural roads rated poor: 2%
- Percentage of urban roads rated poor: 9%
- Yearly road improvement spend: $2.134 billion
42. Utah
- Fatalities per 100 million miles driven: 0.912
- Percentage of rural roads rated poor: 2%
- Percentage of urban roads rated poor: 7%
- Yearly road improvement spend: $1.679 billion
43. Georgia
- Fatalities per 100 million miles driven: 1.43
- Rural road, % rated poor: 1%
- Urban road, % rated poor: 5%
- Yearly road improvement spend: $3.281 billion
44. Idaho
- Fatalities per 100 million miles driven: 1.22
- Percentage of rural roads rated poor: 5%
- Percentage of urban roads rated poor: 11%
- Yearly road improvement spend: $1.196 billion
45. Florida

- Fatalities per 100 million miles driven: 1.6
- Percentage of rural roads rated poor: 1%
- Percentage of urban roads rated poor: 5%
- Yearly road improvement spend: $10.980 billion
46. Vermont
- Fatalities per 100 million miles driven: 1.03
- Percentage of rural roads rated poor: 3%
- Percentage of urban roads rated poor: 9%
- Yearly road improvement spend: $579.794 million
47. New Hampshire
- Fatalities per 100 million miles driven: 0.869
- Percentage of rural roads rated poor: 3%
- Percentage of urban roads rated poor: 9%
- Yearly road improvement spend: $628.307 million
48. Indiana
- Fatalities per 100 million miles driven: 1.17
- Percentage of rural roads rated poor: 2%
- Percentage of urban roads rated poor: 6%
- Yearly road improvement spend: $3.722 billion
49. Alabama

- Fatalities per 100 million miles driven: 1.38
- Percentage of rural roads rated poor: 1%
- Percentage of urban roads rated poor: 5%
- Yearly road improvement spend: $2.112 billion
50. Minnesota

- Fatalities per 100 million miles driven: 0.76
- Percentage of rural roads rated poor: 3%
- Percentage of urban roads rated poor: 5%
- Yearly road improvement spend: $4.284 billion
Data source: ConsumerAffairs
Car Manufacturer Features That Never Gained Popularity
 Takes a look at some of the more unique car features that were actually created by manufacturers. Not all the features on this list made it to mass production and some had to stop production due to new safety regulations. But, they all show how hard manufacturers work to give us new automotive bling.
Glowing Tires and Rotating Seats: The Car Features That Never Took Off